IELTS Writing Task 1: Pie chart
Posted: Wednesday, July 2, 2014 Filed under: IELTS Writing Task 1 | Tags: task 1/pies 5 CommentsCác bạn tham khảo bài mẫu tôi viết cho biểu đồ pie này nhé.
You should spend about 20 minutes on this task.
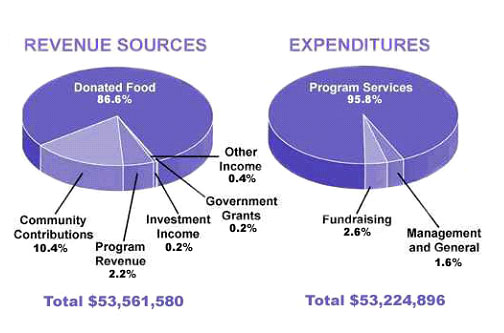
The pie chart shows the amount of money that a children’s charity located in the USA spent and received in one year. Summarize the information by selecting and reporting the main features and make comparisons where relevant.
Write at least 150 words.
Sample report by Thang Trinh
The pie charts indicate the amount of donations given to a US charity towards children and the expenditures of this charity over a period of one year.
Overall, the money donated was slightly higher compared to the amount expended. Donations were from various sources, while there were three sources of expenditures.
The total amount of money that was provided to the charity over the year examined was more than 53,560,000 dollars. A substantial 86.6% of this revenue was from donated food, which was more than 8 times higher than the second highest percentage (10.4%) obtained from Community Contributions. The remaining four other sources contributed very modestly, including Program Revenue, Other Income, Investment Income and Government Grants with 2.2%, 0.4%, 0.2% and 0.2%, respectively.
Regarding the expenditures of approximately 53,220,000 dollars, the vast majority (95.8%) of this money was used for Program Services. The remaining revenue sources were spent on Fundraising (2.6%) and Management and General (1.6%).
(156 words)

Recent Comments